본 문서는 2023년 6월에 작성된 문서입니다. 시간이 지나면 현재 시험 방식과 많이 다를 수 있습니다.


저는 회사에서 2년 넘게 Kubernetes를 사용을 하여 Kubernetes에 익숙한 상태였고 이왕 Kubernetes를 사용할 줄 알게 된 거 이 기회에 CKA를 취득하는 게 좋을 것 같아 시험을 보게 되었습니다. CKA 준비 기간은 2 ~ 3주 정도 걸렸으며 모든 부분을 공부한 것이 아닌 부족한 부분만 골라 보면서 공부를 하였습니다.

결제는 어떻게?

https://training.linuxfoundation.org/certification/certified-kubernetes-administrator-cka/


Certified Kubernetes Administrator (CKA) Exam | Linux Foundation

Training in skills, knowledge, and competency to perform the responsibilities of Kubernetes administrators.

training.linuxfoundation.org

결제 진행 방식은 위 링크를 통해 Linux Foundation에 로그인 후 결제를 진행하면 됩니다. 여기서 약간의 팁은 CKA는 자주 할인을 진행하는데 적게는 15%에서 많게는 40%까지 할인을 받을 수 있습니다. 저 같은 경우 40% 해택을 받아 321,256원으로 결제할 수 있었습니다. 여기서 환율이 적용되기 때문에 환율이 좋을 때 구매를 진행하시면 같은 40% 할인이어도 실제 구매한 가격이 다를 수 있습니다.
할인 코드 확인 방법은 https://training.linuxfoundation.org/blog/ Linux Foudation 블로그에 게시물로 업로드가 되는데 그때 코드를 받아 결제를 진행하시면 됩니다.

CKA 공부 방법

저는 회사에서 Kubernetes를 2년 이상 사용하였습니다. 회사에서 사용하였을 때는 "마사야 야오야마"가 지은 "쿠버네티스 완벽 가이드"라는 책으로 공부를 하였고 CKA 준비를 하기 위해서는 Udemy에 "Mumshad Mannambeth"의 "Certified Kubernetes Administrator (CKA) with Practice Tests" 강의를 들었습니다. 저는 어느 정도 Kubernetes를 사용하여 부족한 부분만 골라서 강의를 들었습니다. 여기서 제공하는 실습문제가 실제로 많이 도움이 되었기 때문에 실습문제는 반드시 풀어보는 게 좋습니다. 이 강의 또한 할인을 자주 하기 때문에 관심등록을 통해 할인한다는 알림을 받게 되면 그때 구입하는 것을 추천드립니다. 원래 가격은 99,000원이지만 할인을 받게 되면 15,000에서 20,000원에 결제할 수 있습니다.

https://www.udemy.com/course/certified-kubernetes-administrator-with-practice-tests/

Killer.sh 후기

CKA 시험을 결제하게 되면 Killer.sh라는 실제 시험 환경과 아주 비슷한 환경을 제공해 줍니다. 세션을 시작하면 36시간 동안 지속적으로 비슷한 시험 환경에서 예상문제를 풀 수 있는 세션을 2개 줍니다. 1개의 세션은 36시간 동안 접속할 수 있기 때문에 주말에 문제를 여러 번 풀어보면 많은 도움이 됩니다. 세션은 2개 주지만 2개의 세션 모두 시험문제가 동일하니 굳이 2개의 세션을 사용하지 않으셔도 됩니다. 참고로 Killer.sh는 실제 CKA 시험 문제보다 어려운 문제가 나오니 여기서 좋지 못한 점수를 받았다고 낙심하지 마세요. 그리고 Killer.sh는 문제와 풀이 과정까지 전부 PDF로 제공하여 부족한 부분을 공부하는데 좋습니다.

CKA 당일!!!

PSI 브라우저 설치

시험 날짜를 정하고 나면 이메일로 PSI 브라우저를 설치할 수 있는 링크를 보내줍니다. PSI 브라우저는 시험 보기 30분 전에 설치할 수 있으며 설치가 완료되고 PSI를 구동하면 PSI와 동시에 동작할 수 없는 프로세서를 강제적으로 종료하고 시험에 입장을 하게 됩니다. 이때 PSI와 같이 동작할 수 없는 프로그램은 대표적으로 크롬입니다. 참고로 PSI에서 버튼을 누르면 PSI가 알아서 프로그램을 종료하니 미리 프로그램을 종료하지 않으셔도 됩니다. 

준비물

폐쇄된 공간(집보다는 주말에 회사에 출근하여 폐쇄된 회의실에서 시험을 보는 것을 추천), 여권, 웹캠(노트북 가능), 최소 15인치 이상의 화면(듀얼모니터 불가능)

감독관과의 소통

PSI 브라우저 설치가 모두 정상적으로 끝나면 감독관과 채팅을 하게 되는데.. 영어를 잘 모르는 저의 입장에서는 모든 시험 통틀어서 가장 힘든 순간이었습니다. 먼저 여권으로 신원을 확인하고 노트북에 달린 웹캠으로 시험 보는 공간을 감독관에게 확인시켜주어야 합니다. 그리고 감독관이 주변에 어떠한 물건을 치우라고 하면 바로바로 치워주면 시험을 시작하게 됩니다. 저는 감독관과 채팅을 시작하자마자 "I am not good english"라고 알려주었더니 제가 영어를 못 알아듣는 거 같으니 감독관 단어 하나씩 채팅에 쳐서 알려주는 친절함을 보여주었습니다. 그러니 영어를 잘 모르더라도 너무 두려워하지 않으셔도 됩니다.

실제 시험 환경

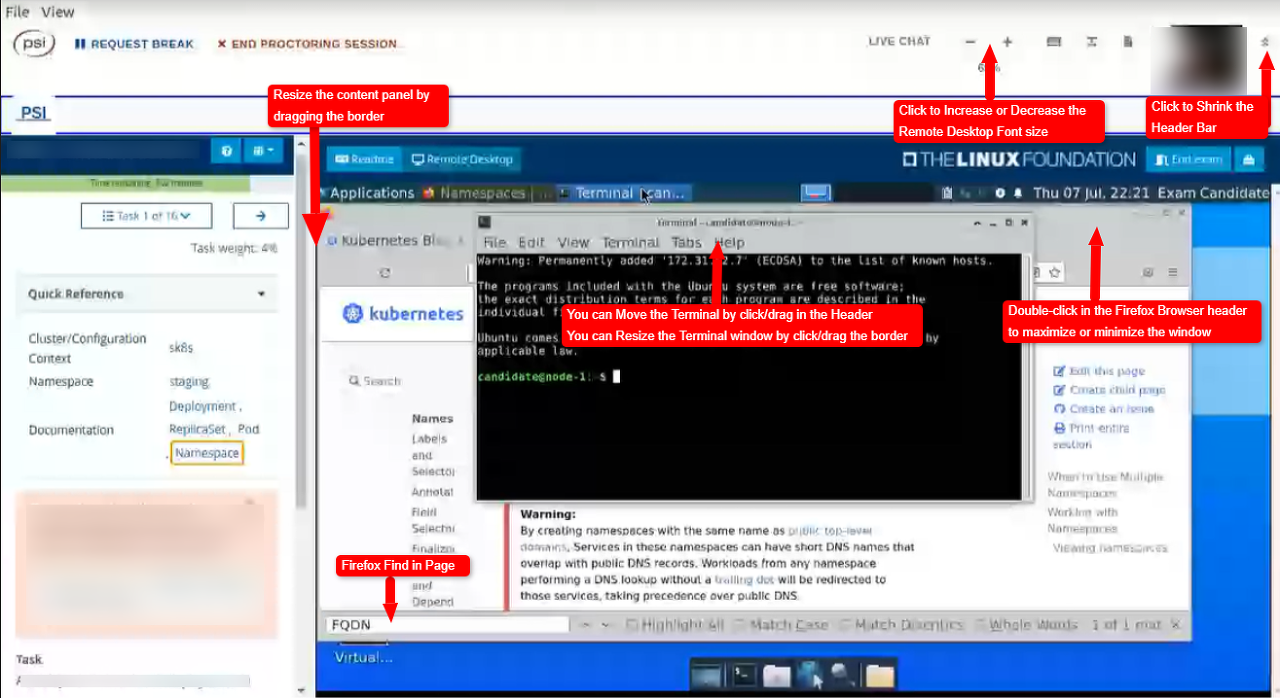
시험장에 들어가면 아래 이미지와 같은 환경에서 시험을 보게 됩니다. 우측 상단에는 응시자(본인)의 얼굴이 나오는데 화면에 반드시 얼굴이 벗어나면 안 됩니다. 얼굴이 화면에 벗어나게 되면 채팅창으로 감독관이 카메라에 얼굴이 나와야 된다는 메시지를 보냅니다. 그리고 가장 중요한 팁은 바로 복사 붙여 넣기인데요 저는 윈도우 노트북으로 시험을 진행하였는데 터미널과 파이어폭스, 메모장의 복붙 단축키가 다릅니다.
터미널 : ctrl + shift + c(복사), ctrl + shift + v(붙여 넣기)
파이어폭스, 메모장 : ctrl + c(복사), ctrl + v(붙여 넣기)
파이어폭스 Kubernets document에서 yaml을 복사할 때는 ctrl + c로 복사하여 터미널에서는 ctrl + shift + v로 붙여 넣어야 합니다.

참고로 현재는 문제의 언어를 선택할 수 있는데 영어, 중국어, 일본어만 제공하고 있습니다.
그리고 정말 인터넷이 아주 느리니 무조건 유선으로 시험 보는 것을 추천드리고 생각보다 PSI 브라우저가 매우 무겁습니다. 그렇기 때문에 어느 정도 성능이 좋은 컴퓨터로 시험을 보는 것을 추천드립니다.

CKA 문제 유형

문제는 15 ~ 20개 정도 나오고 2시간 동안 풀 수 있습니다. 저의 경우 17문제 나왔고 문제의 유형은 아래 리스트처럼 나왔습니다.

  • pod 생성
  • 멀티 컨테이너 pod 생성
  • 사이드카 컨테이너 pod 생성
  • deploy, statefulset, daemonset 등 생성
  • service expose
  • pv, pvc 생성 후 마운트
  • ingress, networkpolicy
  • rbac
  • etcd 백업
  • version upgrade
  • Troubleshooting

CKA Tip

  1. kubectl 자동완성은 기본적으로 적용되어 있습니다.
  2. alias k="kubectl"은 기본적으로 적용되어 있습니다.
  3. etcdctl 이 이미 설치되어 있습니다.
  4. export do="--dry-run=client -o yaml"를 미리 정의해 두면 dry-run을 수행할 때 조금은 더 빠르게 작업할 수 있습니다.
  5. kubectl create --help를 통해 create로 생성할 수 있는 리소스는 create로 생성하고 create로 생성할 수 없는 리소스는 kubernetes document에서 복사하는 게 빠릅니다. (예시로 pv, pvc는 빨리 document에서 복사해 오자)
  6. PSI 브라우저 바탕화면에서 우클릭하여 메모장을 생성 후 사용할 수 있습니다.
  7. 파이어폭스에서 ctrl + f로 검색을 하고 아래에 search highlight 체크박스 선택을 통해 검색을 강조하여 볼 수 있습니다.
  8. 파이어폭스에서 실수로 ctrl + shift + c를 누르면.. 개발자 모드가 나오는데 인터넷이 매우 느려 개발자 모드를 끄는데도 5 ~ 10초 정도 소요됩니다.
  9. 내 얼굴이 나오는 상단 메뉴를 접어 화면을 조금 더 크게 사용할 수 있다.

외우면 좋은 거

  1. etcd 백업 방법
  2. manifest위치 (/etc/kubernetes/manifests)
  3. PKI 위치 (/etc/kubernetes/pki/)
  4. 파드 DNS 확인 (kubectl exec -it 파드명 -- cat /etc/resolv.conf)
  5. kubelet 로그 확인 (journalctl -u kubelet)

CKA 시험 결과

2023년 6월 6일 시험을 봤고 6월 7일에 시험 결과가 나왔고 결과는 한 번에 합격할 수 있었습니다.!!!
CKA에 도전하는 분들 모두 응원합니다.


Elasticsearch의 성능을 위해 데이터를 한 건 한 건 처리하는 것이 아닌 bulk를 이용하여 한 번에 처리하는 경우가 많습니다.
bulk를 사용하여 많은 양의 데이터를 Elasticsearch에 저장할 경우 분명 HTTP 요청은 정상적으로 끝이 났는데 데이터가 저장이 안 되는 경우가 발생할 수 있습니다. 여기서 중요한 것은 Elasticsearch로 보낸 HTTP의 Response는 200이라는 정상적인 값을 리턴을 하기 때문에 문제를 찾기가 어려운데요. 이럴 때는 Response의 state code를 보는 것이 아라 Response의 body의 내용을 볼 필요가 있습니다.

문제 해결방법

해당 문제를 해결하는 방법은 2가지 방법이 있습니다.

  1. 한번에 요청하는 bulk의 사이즈를 줄인다 : 만약 자원의 부족으로 thread 설정이 불가능한 경우 한번에 처리하는 bulk의 개수를 줄여서 해당 문제를 해결할 수 있습니다.
  2. thread_pool의 wrtie queue size를 늘린다 : http request connect를 통한 부하를 줄이는 것이 더 중요한 경우 1번 방법을 사용할 수 없습니다. 그런 경우 thread가 처리할 수 있는 자원이 있을 때 2번 방법을 통하여 한번에 처리할 수 있는 bulk의 양을 늘려서 문제를 해결할 수 있습니다.

모든 상황에 만족하는 문제 해결은 없습니다. 본인의 환경에 맞는 문제 해결 방법을 찾고 해당 방법을 적용하는 것을 추천드립니다.

아래는 2번 방법을 통해 한번에 처리할 수 있는 bulk의 양을 늘리는 방법에 대해 정리하였습니다.

설정 변경하기

Elasticsearch 디렉토리 위치에 config/elasticsearch.yml파일에 다음과 같은 설정 값을 추가하고 Elasticsearch를 재시작합니다.

thread_pool.write.queue_size: 2000
thread_pool.write.size: 16

설정을 진행하자가 문제가 발생한 경우

만약 다음과 같은 메시지가 발생한 다면 thread_pool.write.size의 값을 13보다 작은 값으로 설정하세요.

java.lang.IllegalArgumentException: Failed to parse value [16] for setting [thread_pool.write.size] must be <= 13

설정값의 의미

  • thread_pool.write.size : write를 수행하는 스레드 풀의 스레드 수
  • thread_pool.write.queue_size : write를 할 때 사용되는 스레드 풀의 큐 크기
  • thread_pool.search.size : search를 수행하는 스레드 풀의 스레드 수
  • thread_pool.search.queue_size : earch를 할 때 사용되는 스레드 풀의 큐 크기

마지막으로

thread에 대한 설정은 노드의 리소스 스펙에 한계가 있기 때문에 어느 정도 설정 값 튜닝을 했음에도 불구하고 더 이상의 성능 향상이 없을 경우 노드의 Scale up을 고려하는 것을 추천드립니다.


Go언어 처음 설치라면 2번부터 진행하시면 됩니다.

1. Go 제거하기

# go언어 제거 하기
sudo apt-get purge golang*
sudo rm -rf /usr/local/go
sudo rm -rf $(echo $GOPATH)

# ~/bashrc 또는 ~/.profile에서 go 관련된 항목 제거(기존에 설정한 파일에서 작업)
source ~/.profile
source ~/.bashrc

# 제거 확인
go version


2. apt-get 업데이트 하기

sudo apt-get update
sudo apt-get -y upgrade


3. wget 설치 확인 및 wget 설치

# wget 설치 확인 & wget 없을 경우 wget 설치
which wget
sudo apt-get install wget


4. Go 최신 버전 설치하기

https://go.dev/dl/


Downloads - The Go Programming Language

Downloads After downloading a binary release suitable for your system, please follow the installation instructions. If you are building from source, follow the source installation instructions. See the release history for more information about Go releases

go.dev


위 링크에서 최신 버전(현재 최신 버전은 1.19.2)의 linux-amd64.tar.gz에 우클릭하여 링크 주소를 복사하고 wget으로 다운로드합니다.

# go 다운로드
wget https://golang.org/dl/go1.19.2.linux-amd64.tar.gz

# 압축 풀기
sudo tar -C /usr/local -xvf go1.19.2.linux-amd64.tar.gz

# 환경변수 설정
mkdir ~/go
echo "export GOROOT=/usr/local/go" >> ~/.profile
echo "export PATH=$PATH:/usr/local/go/bin" >> ~/.profile
echo "export GOPATH=$HOME/go" >> ~/.profile
source ~/.profile
echo $GOPATH

# go version 확인하기
go version


'Go언어' 카테고리의 다른 글

golang version upgrade (ubuntu)  (0) 2023.07.09
go work 사용해보기  (0) 2023.07.06
Go언어 interface reflect  (0) 2021.08.15
Go언어 Cron  (0) 2021.06.15
Prometheus Go언어 Metric label  (0) 2021.06.14

Aggregations을 수행할 때 사용할 데이터


Sub Aggregations

aggregation을 통해 집계를 내고 그 결과에서 세부적인 집계를 위해 Sub Aggregation을 지원하고 있습니다.


level 필드별 duration의 평균 시간 구하기

우리는 데이터를 가져오는 것이 목적이 아닌 Aggregations을 수행하는 것이 목적이기 때문에 "size"를 0으로 설정하였습니다.

api POST http://localhost:9200/test-log-index-2021-09-12/_search
header content-type: application/json
body {
    "size": 0,
    "query": {
        "match_all": {}
    },
    "aggs": {
        "byLevel": {
            "terms": {
                "field": "level"
            },
            "aggs": {
                "avgDuration": {
                    "avg": {
                        "field": "duration"
                    }   
                }
            }
        }
    }
}

결과 보기

level의 "info"는 9개가 있으며 9개의 duration 평균은 167.777777입니다.

level의 "warn"는 6개가 있으며 6개의 duration 평균은 333.33333입니다.

level의 "debug"는 5개가 있으며 5개의 duration 평균은 258입니다.


level별 action 종류 및 개수 측정하기

우리는 데이터를 가져오는 것이 목적이 아닌 Aggregations을 수행하는 것이 목적이기 때문에 "size"를 0으로 설정하였습니다.

api POST http://localhost:9200/test-log-index-2021-09-12/_search
header content-type: application/json
body {
    "size": 0,
    "query": {
        "match_all": {}
    },
    "aggs": {
        "byLevel": {
            "terms": {
                "field": "level"
            },
            "aggs": {
                "byAction": {
                    "terms": {
                        "field": "action"
                    }   
                }
            }
        }
    }
}

결과 보기

{
    "took": 4,
    "timed_out": false,
    "_shards": {
        "total": 1,
        "successful": 1,
        "skipped": 0,
        "failed": 0
    },
    "hits": {
        "total": {
            "value": 20,
            "relation": "eq"
        },
        "max_score": null,
        "hits": []
    },
    "aggregations": {
        "byLevel": {
            "doc_count_error_upper_bound": 0,
            "sum_other_doc_count": 0,
            "buckets": [
                {
                    "key": "info",
                    "doc_count": 9,
                    "byAction": {
                        "doc_count_error_upper_bound": 0,
                        "sum_other_doc_count": 0,
                        "buckets": [
                            {
                                "key": "close_file",
                                "doc_count": 4
                            },
                            {
                                "key": "open_file",
                                "doc_count": 4
                            },
                            {
                                "key": "open_socket",
                                "doc_count": 1
                            }
                        ]
                    }
                },
                {
                    "key": "warn",
                    "doc_count": 6,
                    "byAction": {
                        "doc_count_error_upper_bound": 0,
                        "sum_other_doc_count": 0,
                        "buckets": [
                            {
                                "key": "close_file",
                                "doc_count": 2
                            },
                            {
                                "key": "open_file",
                                "doc_count": 2
                            },
                            {
                                "key": "close_socket",
                                "doc_count": 1
                            },
                            {
                                "key": "open_socket",
                                "doc_count": 1
                            }
                        ]
                    }
                },
                {
                    "key": "debug",
                    "doc_count": 5,
                    "byAction": {
                        "doc_count_error_upper_bound": 0,
                        "sum_other_doc_count": 0,
                        "buckets": [
                            {
                                "key": "close_file",
                                "doc_count": 2
                            },
                            {
                                "key": "open_file",
                                "doc_count": 2
                            },
                            {
                                "key": "close_socket",
                                "doc_count": 1
                            }
                        ]
                    }
                }
            ]
        }
    }
}

"info"는 9개이며 그중에 "close_file"는 4개, "open_file"은 4개, "open_socket"은 1개 입니다.

"warn"는 6개이며 그중에 "close_file"는 2개, "open_file"은 2개, "open_socket"은 1개, "close_socket"은 1개입니다.

"info"는 9개이며 그중에 "close_file"는 2개, "open_file"은 2개, "close_socket"은 1개입니다.


Aggregation을 수행할 때 사용할 데이터

terms

terms는 데이터의 keyword별 종류 및 개수를 집계하는데 사용합니다.


모든 도큐먼트의 level의 종류와 개수 구하기

우리는 데이터를 가져오는 것이 목적이 아닌 Aggregation을 수행하는 것이 목적이기 때문에 "size"를 0으로 설정하였습니다.

level 필드의 데이터 종류와 각 종류별로 도큐먼트가 몇개 있는지 확인합니다.

api POST http://localhost:9200/test-log-index-2021-09-12/_search
header content-type: application/json
body {
    "size": 0,
    "query": {
        "match_all": {}
    },
    "aggs": {
        "byLevel": {
            "terms": {
                "field": "level"
            }
        }
    }
}

결과 보기

"byLevel" 내부의 buckets를 보면 "key"에는 level필드의 값이 "doc_count"에는 개수를 표현하고 있습니다.

즉 "info"는 9개가 있고, "warn"은 6개, "debug"는 5개가 있는 것을 확인할 수 있습니다.


range

값의 범위 별로 도큐먼트의 개수를 측정하는데 사용할 수 있습니다.


모든 도큐먼트의 duration의 범위별 개수 측정하기

우리는 데이터를 가져오는 것이 목적이 아닌 Aggregations을 수행하는 것이 목적이기 때문에 "size"를 0으로 설정하였습니다.

duration의 범위 100이하, 100부터 200까지, 200부터 300까지, 300부터 400까지, 400이상 으로 범위를 지정하여 검색하겠습니다.

api POST http://localhost:9200/test-log-index-2021-09-12/_search
header content-type: application/json
body {
    "size": 0,
    "query": {
        "match_all": {}
    },
    "aggs": {
        "byDuration": {
            "range": {
                "field": "duration",
                "ranges": [
                    {
                        "to": 100
                    },
                    {
                        "from": 100,
                        "to": 200
                    },
                    {
                        "from": 200,
                        "to": 300
                    },
                    {
                        "from": 300,
                        "to": 400
                    },
                    {
                        "from": 400
                    }
                ]
            }
        }
    }
}

결과 보기


histogram

range의 경우 from, to를 통하여 범위를 지정했다면 histogram은 range와 다르게 interval옵션을 통하여 interval단위 별로 필드의 개수를 측정하는 Aggregations입니다.


모든 도큐먼트의 duration을 100 단위로 개수 측정하기

우리는 데이터를 가져오는 것이 목적이 아닌 Aggregations을 수행하는 것이 목적이기 때문에 "size"를 0으로 설정하였습니다.

api POST http://localhost:9200/test-log-index-2021-09-12/_search
header content-type: application/json
body {
    "size": 0,
    "query": {
        "match_all": {}
    },
    "aggs": {
        "byDuration": {
            "histogram": {
                "field": "duration",
                "interval": 100
            }
        }
    }
}

결과 보기

100 단위 별로 도큐먼트의 개수를 확인할 수 있습니다.


date_range

range처럼 date필드 또한 범위를 지정하여 집계를 할 수 있습니다.


모든 도큐먼트의 start_time 필드를 범위 별로 측정하기

우리는 데이터를 가져오는 것이 목적이 아닌 Aggregations을 수행하는 것이 목적이기 때문에 "size"를 0으로 설정하였습니다.

"start_time"필드의 값을 범위 별로 측정하도록 하겠습니다.

api POST http://localhost:9200/test-log-index-2021-09-12/_search
header content-type: application/json
body {
    "size": 0,
    "query": {
        "match_all": {}
    },
    "aggs": {
        "date_range": {
            "date_range": {
                "field": "start_time",
                "ranges": [
                    {
                        "from": "2021-09-12 10:10:10",
                        "to": "2021-09-12 10:10:15"
                    },
                    {
                        "from": "2021-09-12 10:10:15",
                        "to": "2021-09-12 10:10:20"
                    },
                    {
                        "from": "2021-09-12 10:10:20"
                    }
                ]
            }
        }
    }
}

결과 보기

각 시간대별로 도큐먼트의 개수를 확인할 수 있습니다.


date_histogram

histogram과 같이 date_histogram도 interval 옵션을 넣어 각 interval별 집계를 측정할 수 있습니다.

interval옵션에 second, minute, hour, day, month, week 등을 넣을 수 있습니다.


모든 도큐먼트의 start_time 필드를 1분 별로 측정하기

우리는 데이터를 가져오는 것이 목적이 아닌 Aggregations을 수행하는 것이 목적이기 때문에 "size"를 0으로 설정하였습니다.

api POST http://localhost:9200/test-log-index-2021-09-12/_search
header content-type: application/json
body {
    "size": 0,
    "query": {
        "match_all": {}
    },
    "aggs": {
        "date_his": {
            "date_histogram": {
                "field": "start_time",
                "interval": "minute"
            }
        }
    }
}

결과 보기


Aggregation을 수행할 때 사용할 데이터


cardinality

cardinality는 데이터의 종류가 몇 가지 있는지 확인하는 데 사용됩니다.


user_id가 1인 도큐먼트에 action이 몇가지 종류가 있는지 확인하기

우리는 데이터를 가져오는 것이 목적이 아닌 Aggregations을 수행하는 것이 목적이기 때문에 "size"를 0으로 설정하였습니다.

api POST http://localhost:9200/test-log-index-2021-09-12/_search
header content-type: application/json
body {
    "size": 0,
    "query": {
        "bool": {
            "must": [
                {
                    "match": {
                        "user_id": "1"
                    }
                }
            ]
        }
    },
    "aggs": {
        "cardinality_by_action": {
            "cardinality": {
                "field": "action"
            }
        }
    }
}

결과 보기

"cardinality_by_action"를 통해 user_id가 1인 도큐먼트에서는 action의 종류가 4개가 있다는 것을 확인할 수 있습니다.

실제로 "open_file", "close_file", "open_socket", "close_socket" 이렇게 4개입니다.


percentiles

각각의 값을 백분율로 보는 Aggregations입니다. 퍼센트 옵션을 설정하지 않으면 디폴트로 [1, 5, 25, 50, 75, 95, 99]로 설정됩니다.


user_id가 1인 도큐먼트에 duration의 백분율 확인하기

우리는 데이터를 가져오는 것이 목적이 아닌 Aggregations을 수행하는 것이 목적이기 때문에 "size"를 0으로 설정하였습니다.

api POST http://localhost:9200/test-log-index-2021-09-12/_search
header content-type: application/json
body {
    "size": 0,
    "query": {
        "bool": {
            "must": [
                {
                    "match": {
                        "user_id": "1"
                    }
                }
            ]
        }
    },
    "aggs": {
        "percentiles_by_duration": {
            "percentiles": {
                "field": "duration"
            }
        }
    }
}

결과 보기

하위 1%의 값은 100이며, 상위 99%의 값은 430인 것을 확인할 수 있습니다.


퍼센트를 설정하여 확인하기

이제는 디폴트 퍼센트값이 아닌 퍼센트를 사용자가 [25, 50, 75]로 지정하여 검색하겠습니다.

api POST http://localhost:9200/test-log-index-2021-09-12/_search
header content-type: application/json
body {
    "size": 0,
    "query": {
        "bool": {
            "must": [
                {
                    "match": {
                        "user_id": "1"
                    }
                }
            ]
        }
    },
    "aggs": {
        "percentiles_by_duration": {
            "percentiles": {
                "field": "duration",
                "percents": [ 25, 50, 75 ]
            }
        }
    }
}

결과 보기


percentile_ranks

지정한 값이 백분율로 몇 퍼센트 안에 속하는지 확인할 수 있습니다.

values라는 옵션으로 값을 지정할 수 있습니다.


user_id가 1인 도큐먼트에 필드 duration에 100, 200, 300의 값이 있다면 백분율 몇 퍼센트인지 확인하기

우리는 데이터를 가져오는 것이 목적이 아닌 Aggregations을 수행하는 것이 목적이기 때문에 "size"를 0으로 설정하였습니다.

api POST http://localhost:9200/test-log-index-2021-09-12/_search
header content-type: application/json
body {
    "size": 0,
    "query": {
        "bool": {
            "must": [
                {
                    "match": {
                        "user_id": "1"
                    }
                }
            ]
        }
    },
    "aggs": {
        "rank_by_duration": {
            "percentile_ranks": {
                "field": "duration",
                "values": [ 100, 200, 300 ]
            }
        }
    }
}

결과 보기


Aggregation을 수행할 때 사용할 데이터

Aggregations이란

저장된 데이터를 수치화시키는 여러 가지의 연산을 수행하는 역할을 합니다. 이러한 기능을 통하여 데이터를 분석하여 사용자가 보기 좋게 시각화를 할 수 있습니다.


이번 페이지에서는 min, max, sum, avg, stats에 대하여 알아보겠습니다.

min

query의 검색 결과에 특정 필드의 값이 가장 작은 값을 나타냅니다.


user_id가 1인 도큐먼트의 duration 필드의 최솟값 구하기

"size"를 0으로 설정한 이유는 우리는 데이터를 가져오는 것이 목적이 아닌 user_id가 1인 도큐먼트에서 duration이 가장 작은 값만 도출하는 것이 목적이기 때문에 불필요하게 데이터를 가져오는 것을 생략하기 위함입니다.

"aggs"를 통하여 쿼리에 Aggregation을 선언하고 "minDuration"이라는 Aggregation의 이름을 사용자가 지정합니다. 그리고 "min"을 통하여 duration이라는 필드의 최솟값을 측정하도록 합니다.

api POST http://localhost:9200/test-log-index-2021-09-12/_search
header content-type: application/json
body {
    "size": 0,
    "query": {
        "bool": {
            "must": [
                {
                    "match": {
                        "user_id": "1"
                    }
                }
            ]
        }
    },
    "aggs": {
        "minDuration": {
            "min": {
                "field": "duration"
            }
        }
    }
}

결과 보기

"hits"는 검색 결과를 나타내지만 우리는 "size"를 0으로 설정하였기 때문에 결과값은 나오지 않습니다.

"aggregations"에 우리가 지정한 "minDuration"이라는 명칭으로 최소값이 100이라는 결과가 나왔습니다.


max

query의 검색 결과에 특정 필드의 값이 가장 큰 값을 나타냅니다.


user_id가 1인 도큐먼트의 duration 필드의 최대값 구하기

"maxDuration"이라는 명칭으로 duration의 값이 가장 큰 값을 구하는 쿼리입니다.

api POST http://localhost:9200/test-log-index-2021-09-12/_search
header content-type: application/json
body {
    "size": 0,
    "query": {
        "bool": {
            "must": [
                {
                    "match": {
                        "user_id": "1"
                    }
                }
            ]
        }
    },
    "aggs": {
        "maxDuration": {
            "max": {
                "field": "duration"
            }
        }
    }
}

결과 보기

maxDuration을 통하여 user_id가 1인 도큐먼트에서 duration이 가장 큰 값은 430이라는 결과를 알 수 있습니다.


sum

query의 검색 결과에 특정 필드의 값을 전부 더한 값을 나타냅니다.


user_id가 1인 도큐먼트의 duration 필드의 전부 더한 값 구하기

"sumDuration"이라는 명칭으로 user_id가 1인 duration의 값을 전부 더한 값을 구하는 쿼리입니다.

api POST http://localhost:9200/test-log-index-2021-09-12/_search
header content-type: application/json
body {
    "size": 0,
    "query": {
        "bool": {
            "must": [
                {
                    "match": {
                        "user_id": "1"
                    }
                }
            ]
        }
    },
    "aggs": {
        "sumDuration": {
            "sum": {
                "field": "duration"
            }
        }
    }
}

결과 보기

sumDuration을 통하여 user_id가 1인 도큐먼트에서 duration을 전부 더한 값이 2600이라는 것을 알 수 있습니다.


avg

query의 검색 결과에 특정 필드의 값의 평균 값을 나타냅니다.


user_id가 1인 도큐먼트의 duration 필드의 전부 더한 값 구하기

"avgDuration"이라는 명칭으로 user_id가 1인 duration의 값의 평균을 구하는 쿼리입니다.

api POST http://localhost:9200/test-log-index-2021-09-12/_search
header content-type: application/json
body {
    "size": 0,
    "query": {
        "bool": {
            "must": [
                {
                    "match": {
                        "user_id": "1"
                    }
                }
            ]
        }
    },
    "aggs": {
        "avgDuration": {
            "avg": {
                "field": "duration"
            }
        }
    }
}

결과 보기

avgDuration을 통하여 user_id가 1인 도큐먼트에서 duration의 평균값이 216.66666666이라는 것을 알 수 있습니다.


stats

stats를 통하여 위에서 본 count, min, max, sum, avg의 모든 결과를 가져올 수 있습니다.


user_id가 1인 도큐먼트의 duration 필드의 stats 결과 값 확인하기

"statsDuration"이라는 명칭으로 user_id가 1인 도큐먼트의 count, min, max, sum, avg의 값을 확인하는 쿼리입니다.

api POST http://localhost:9200/test-log-index-2021-09-12/_search
header content-type: application/json
body {
    "size": 0,
    "query": {
        "bool": {
            "must": [
                {
                    "match": {
                        "user_id": "1"
                    }
                }
            ]
        }
    },
    "aggs": {
        "statDuration": {
            "stats": {
                "field": "duration"
            }
        }
    }
}

결과 보기

"statDuration"을 통해 count, min, max, avg, sum의 결과 값을 확인할 수 있습니다.


그렇다면 min만 필요하더라도 stats하나로 모든 결과 값을 구하면 된다고 생각할 수 있습니다. 그러나 이러한 생각은 좋지 못한 생각입니다. min만 구하기 위해서 stats를 사용하는 것은 매우 안 좋은 선택입니다. 이 이유는 Elasticsearch에게 그만큼 많은 부하를 줄 수 있기 때문입니다. 그러나 반대로 min, max, sum을 구해야 될 경우에는 min, max, sum 각각 3번의 검색을 수행하는 것보다는 stats를 한 번을 사용하여 네트워크 I/O를 줄여 주는 것이 더 현명한 선택이라고 생각됩니다.


삽입된 데이터는 이전 페이지를 참조해주세요

https://stdhsw.tistory.com/entry/Elasticsearch-%EA%B2%80%EC%83%89%ED%95%98%EA%B8%B01


match 쿼리

match는 term과 비슷해 보이지만 미묘한 차이가 있습니다. match의 경우 기본적인 검색을 수행하는데 사용을 하지만 저 같은 경우 text 필드에서 보다 상세한 검색을 수행할 경우 주로 사용됩니다.  즉 문서의 내용에서 특정 단어가 들어 갔는지 검색할때 많이 사용됩니다.


text 필드 검색하기

message 필드에 "aaa"라는 문자열이 포함된 모든 도큐먼트를 검색합니다.

api POST http://localhost:9200/my-log-index-2021-08-29/_search
header Content-type: application/json
body {
    "query": {
        "bool": {
            "must": [
                {
                    "match": {
                        "message": "aaa"
                    }
                }
            ]
        }
    }
}


term 쿼리

term의 경우 match와 비슷한 모습을 취하지만 term은 완전히 같은 데이터를 검색하는데 많이 사용됩니다. 저 같은 경우 주로 keyword타입에서 특정 단어를 검색하는데 많이 사용하고 있습니다.


keyword 타입 검색하기

level 필드의 값이 "info"인 값을 가진 도큐먼트를 검색합니다.

api POST http://localhost:9200/my-log-index-2021-08-29/_search
header Content-type: application/json
body {
    "query": {
        "bool": {
            "must": [
                {
                    "term": {
                        "level": "info"
                    }
                }
            ]
        }
    }
}


range 쿼리

range 쿼리는 값의 범위를 검색하는데 사용됩니다. 


range쿼리의 파라미터

파라미터명 설명
gte 크거나 같다
gt 크다
lte 작거나 같다
lt 작다


범위를 이용하여 검색하기

user_id가 2보다 크거나 같으면서 7보다 작은 도큐먼트 검색하기

api POST http://localhost:9200/my-log-index-2021-08-29/_search
header Content-type: application/json
body {
    "query": {
        "bool": {
            "must": [
                {
                    "range": {
                        "user_id": {
                            "gte": "2",
                            "lt": "7"
                        }
                    }
                }
            ]
        }
    }
}


데이터는 이전 페이지를 참조해주세요

https://stdhsw.tistory.com/entry/Elasticsearch-%EA%B2%80%EC%83%89%ED%95%98%EA%B8%B01

bool 쿼리

Elasticsearch에서 보다 자세한 검색을 위해 복합 쿼리가 필요합니다. 이럴 때 bool을 사용하게 됩니다. bool 쿼리에는 must, must_not, should가 있고 이러한 쿼리를 이용하여 score에 점수를 매길 수 있습니다. score의 점수가 높을수록 보다 정확한 결괏값을 도출할 수 있습니다.

must

must는 검색 조건에 반듯이 포함한 도큐먼트를 가져옵니다.


keyword타입 검색하기

level필드에 값이 "info"값을 가지는 모든 도큐먼트를 검색합니다.

참고로 level필드의 타입은 keyword입니다.

api POST http://localhost:9200/my-log-index-2021-08-29/_search
header Content-type: application/json
body {
    "query": {
        "bool": {
            "must": {
                "match": {
                    "level": "info"
                }
            }
        }
    }
}


복합 쿼리 검색하기

level필드의 값이 "info"이며, message에 "aaa"값을 포함하는 도큐먼트를 검색합니다.

level필드는 keyword이며, message는 text입니다.

api POST http://localhost:9200/my-log-index-2021-08-29/_search
header Content-type: application/json
body {
    "query": {
        "bool": {
            "must": [
                {
                    "match": {
                        "level": "info"
                    }
                },
                {
                    "match": {
                        "message": "aaa"
                    }
                }
            ]
        }
    }
}


text타입 OR 검색하기

message필드의 값이 "aaa" 또는 "open" 중 하나 이상의 값을 가지는 도큐먼트를 검색합니다.

만약 "aaa"와 "open"의 값 모두 가지고 있다면 score의 점수가 더 높습니다.

api POST http://localhost:9200/my-log-index-2021-08-29/_search
header Content-type: application/json
body {
    "query": {
        "bool": {
            "must": [
                {
                    "match": {
                        "message": "aaa open"
                    }
                }
            ]
        }
    }
}


text타입 AND 검색하기

message필드의 값이 "aaa"와 "open" 모든 값을 가지는 도큐먼트를 검색합니다.

api POST http://localhost:9200/my-log-index-2021-08-29/_search
header Content-type: application/json
body {
    "query": {
        "bool": {
            "must": [
                {
                    "match": {
                        "message": "aaa"
                    }
                },
                {
                    "match": {
                        "message": "open"
                    }
                }
            ]
        }
    }
}

must_not

must_not은 검색 조건에 반듯이 포함하지 않은 도큐먼트를 가져옵니다.


must_not 쿼리 검색하기

level필드에 값이 "info"가 아닌 모든 도큐먼트를 검색합니다.

api POST http://localhost:9200/my-log-index-2021-08-29/_search
header Content-type: application/json
body {
    "query": {
        "bool": {
            "must_not": [
                {
                    "match": {
                        "level": "info"
                    }
                }
            ]
        }
    }
}


must_not 복합 쿼리 검색하기

message 필드의 값이 "open"을 가지며, level 필드의 값이 "info"가 아닌 도큐먼트를 검색합니다.

level은 keyword타입이며, message는 text타입입니다.

api POST http://localhost:9200/my-log-index-2021-08-29/_search
header Content-type: application/json
body {
    "query": {
        "bool": {
            "must": [
                {
                    "match": {
                        "message": "open"
                    }
                }
            ],
            "must_not": [
                {
                    "match": {
                        "level": "info"
                    }
                }
            ]
        }
    }
}

should

should의 경우 반듯이 필요한 것은 아니지만 만약 있다면 score의 점수를 높여 줍니다.

keyword 타입의 경우 OR 검색을 지원하지 않습니다. 그러나 정상적인 방법은 아니지만 저 같은 경우 keyword 타입인 경우 should를 이용하여 OR 검색처럼 사용합니다.


should 쿼리 검색하기

level 필드의 값이 "debug"일 경우 보다 높은 점수를 부여하고 검색합니다.

api POST http://localhost:9200/my-log-index-2021-08-29/_search
header Content-type: application/json
body {
    "query": {
        "bool": {
            "should": [
                {
                    "match": {
                        "level": "debug"
                    }
                }
            ]
        }
    }
}


should 복합 쿼리로 검색하기

message필드에는 "open"의 값을 가진 도큐먼트 중에 level필드에는 "info"의 값을 가지면 보다 높은 score 점수를 부여하여 검색합니다.

(level필드에는 info 이외의 값도 같이 검색됩니다. 그러나 info의 값을 가진 도큐먼트가 더 높은 score 점수를 가집니다.)

api POST http://localhost:9200/my-log-index-2021-08-29/_search
header Content-type: application/json
body {
    "query": {
        "bool": {
            "must": [
                {
                    "match": {
                        "message": "open"
                    }
                }
            ],
            "should": [
                {
                    "match": {
                        "level": "info"
                    }
                }
            ]
        }
    }
}


참조

https://www.elastic.co/guide/en/elasticsearch/reference/current/query-dsl-bool-query.html


Boolean query | Elasticsearch Guide [7.14] | Elastic

A query that matches documents matching boolean combinations of other queries. The bool query maps to Lucene BooleanQuery. It is built using one or more boolean clauses, each clause with a typed occurrence. The occurrence types are: Occur Description must

www.elastic.co


데이터 넣기

지금 넣는 데이터로 앞으로 검색하는 데 사용하겠습니다.

(http request client를 사용하신다면 body에 반듯이 enter 한번 더 입력하세요)

api PUT http://localhost:9200/_bulk
header Content-type: application/json
body {"index": {"_index": "my-log-index-2021-08-29", "_id": 1}}
{"user_id":1, "level":"info", "timestamp": 1630230119, "action": "open_file", "message": "user1 aaa file open"}
{"index": {"_index": "my-log-index-2021-08-29", "_id": 2}}
{"user_id":2, "level":"debug", "timestamp": 1630230120, "action": "open_file", "message": "user2 bbb file open"}
{"index": {"_index": "my-log-index-2021-08-29", "_id": 3}}
{"user_id":3, "level":"info", "timestamp": 1630230121, "action": "open_socket", "message": "user3 socket open"}
{"index": {"_index": "my-log-index-2021-08-29", "_id": 4}}
{"user_id":4, "level":"debug", "timestamp": 1630230121, "action": "open_socket", "message": "user4 ddd socket open"}
{"index": {"_index": "my-log-index-2021-08-29", "_id": 5}}
{"user_id":5, "level":"info", "timestamp": 1630230122, "action": "open_file", "message": "user5 ccc file open"}
{"index": {"_index": "my-log-index-2021-08-29", "_id": 6}}
{"user_id":6, "level":"info", "timestamp": 1630230123, "action": "close_file", "message": "user6 aaa close open"}
{"index": {"_index": "my-log-index-2021-08-29", "_id": 7}}
{"user_id":7, "level":"info", "timestamp": 1630230124, "action": "close_socket", "message": "user7 ccc close socket"}
{"index": {"_index": "my-log-index-2021-08-29", "_id": 8}}
{"user_id":8, "level":"debug", "timestamp": 1630230125, "action": "open_file", "message": "user8 aaa file open"}
{"index": {"_index": "my-log-index-2021-08-29", "_id": 9}}
{"user_id":9, "level":"info", "timestamp": 1630230126, "action": "open_file", "message": "user9 bbb file open"}
{"index": {"_index": "my-log-index-2021-08-29", "_id": 10}}
{"user_id":10, "level":"info", "timestamp": 1630230127, "action": "open_file", "message": "user10 aaa file open"}
{"index": {"_index": "my-log-index-2021-08-29", "_id": 11}}
{"user_id":11, "level":"warn", "timestamp": 1630230128, "action": "open_file", "message": "user11 bbb file open"}
{"index": {"_index": "my-log-index-2021-08-29", "_id": 12}}
{"user_id":12, "level":"info", "timestamp": 1630230128, "action": "open_file", "message": "user12 aaa file open"}
{"index": {"_index": "my-log-index-2021-08-29", "_id": 13}}
{"user_id":13, "level":"info", "timestamp": 1630230129, "action": "open_file", "message": "user13 bbb file open"}


GET으로 데이터 가져오기

일상적으로 많이 사용하였던 방법입니다. GET으로는 도큐먼트 아이디를 통하여 해당 데이터를 가져올 수 있습니다.


도큐먼트 아이디 1 데이터 가져오기

api GET http://localhost:9200/my-log-index-2021-08-29/_doc/1

출력 결과

query를 이용하여 가져오기

이번에는 도큐먼트 아이디가 아닌 query를 통하여 값을 가져오는 방법을 알아보겠습니다.


인덱스의 모든 데이터 가져오기

size는 가져올 수 있는 최대 개수입니다. 이번 결과에서는 size가 없어도 무방합니다.

api POST http://localhost:9200/my-log-index-2021-08-29/_search
header Content-type: application/json
body {
    "size": 1000,
    "query": {
        "match_all": {}
    }
}


필드 값으로 검색하여 데이터 가져오기

active필드에 open_socket 값을 가지는 도큐먼트 가져오기

api POST http://localhost:9200/my-log-index-2021-08-29/_search
header Content-type: application/json
body {
    "query": {
        "match": {
            "action": "open_socket"
        }
    }
}

출력 결과

출력 결과에서 각 태그의 의미는 다음과 같습니다.

took 쿼리 수행 시간
timed_out 쿼리 수행 시간이 넘었는지 확인
_shard 쿼리를 수행한 shard의 정보
_shard.total 쿼리를 수행한 shard의 수
_shard.successful 쿼리 수행을 성공한 shard의 수
_shard.skipped 쿼리를 건너뛴 shard의 수
_shard.failed 쿼리를 실패한 shard의 수
hits 쿼리 수행 결과
hits.total 쿼리 수행에 일치하는 도큐먼트 수
hits.max_score 쿼리 수행후 가장 높은 점수를 가진 값
hits.hits 수행 결과의 도큐먼트 정보들


단어가 아닌 문장으로 검색하기

match_phrase를 이용하여 message필드에 "aaa file"문장을 포함한 도큐먼트를 검색합니다.

api POST http://localhost:9200/my-log-index-2021-08-29/_search
header Content-type: application/json
body {
    "query": {
        "match_phrase": {
            "message": "aaa file"
        }
    }
}


Keyword 

Elasticsearch에는 문자열 필드 중 text와 keyword가 존재합니다. Keyword는 키워드라는 표현 그대로 데이터 자체를 분류하는데 사용하는 타입입니다. 즉 검색 필터로 사용되며, 데이터를 정렬하고 Aggregation으로 데이터를 집계하는데 사용되는 타입입니다. Keyword 타입으로 "hello my elasticsearch"라는 데이터가 색인되면 "hello my elasticsearch" 그대로 데이터가 색인되어 검색 시 "hello my elasticsearch" 그대로 데이터를 검색해야 합니다.


Text

Text 필드는 지정한 분석기를 이용하여 데이터를 분석하는데 사용합니다. 만약 Analyzer를 지정하지 않으면 Standard Analyzer로 설정되는데 "hello my elasticsearch"라는 데이터가 색인되면 "hello", "my", "elasticsearch"로 데이터가 색인되어 keyword와 다르게 "hello"라고 검색을 해도 검색이 됩니다. 즉 유사한 문자열을 검사하거나 Analyzer 설정을 통해 보다 더 전문적인 검색을 수행하는데 사용하는 타입입니다.


정리

간단하게 정리하면 다음과 같습니다.

  Keyword Text
사용 목적 통계, 정렬, 필터링 유사성 및 전문적인 분석
검색 방식 입력된 값과 정확히 일치하는 문자를 검색 설정한 Analyzer에 따라서 검색
색인 방식 입력한 문자열 그대로 색인 토큰으로 분리되어 색인
Aggregation  색인된 데이터로 집계 가능 집계 불가능


Keyword와 Text 타입을 둘다 적용

Text처럼 분석도 필요하지만 Keyword처럼 Aggregation 모두 필요할 때 필드의 타입을 Keyword와 Text 둘 다 적용할 수 있습니다. 사실 별 다른 타입을 지정하지 않으면 기본 값으로 Keyword와 Text 타입 둘 다 적용됩니다. 이런 경우 문득 다방면으로 사용할 수 있을 것 같아 좋아 보일 수 있지만 보다 더 많은 리소스를 사용하기 때문에 사용 목적에 맞게 필드 타입을 지정하여 사용하는 것을 권장합니다.


Array 형식으로 필드에 데이터 저장하기

하나의 필드에 같은 형식의 데이터를 여러 개 넣어야 되는 경우가 많이 발생합니다. 그럴 때 대표적으로 2가지 방식이 있습니다.

1번째 방식으로는 필드와 함께 값을 같이 저장하는 방식입니다.

2번째 방식은 값만 저장하는 방식입니다.

이번에는 이 2가지 방식 모두에 대하여 알아보겠습니다.

1. 필드에 Object형식으로 데이터 리스트 저장하기

하나의 필드와 같이 값을 저장하는 방식으로는 nested를 사용하는 것 입니다.


nested 맵핑 만들기

api PUT http://localhost:9200/object-list-index/
header Content-type: application/json
body {
    "mappings": {
        "properties": {
            "server": {
                "type": "keyword"
            },
            "users": {
                "type": "nested"
            }
        }
    }
}


데이터 넣기

api PUT http://localhost:9200/object-list-index/_doc/1
header Content-type: application/json
body {
    "server": "server1",
    "users": [{"id": "user1"}, {"id": "user2"}, {"id": "user3"}, {"id": "user4"}]
}


데이터 출력하기

api GET http://localhost:9200/object-list-index/_doc/1


2. 필드에 데이터만 리스트로 넣기

이번에는 위에 방식과 다른 그냥 값만 배열 형식으로 넣는 방식입니다.


맵핑만들기

api PUT http://localhost:9200/value-list-index/
header Content-type: application/json
body {
    "mappings": {
        "properties": {
            "server": {
                "type": "keyword"
            },
            "users": {
                "type": "keyword",
                "fields": {
                    "keyword": {
                        "type": "keyword"
                    }
                }
            }
        }
    }
}


데이터 넣기

api PUT http://localhost:9200/value-list-index/_doc/1
header Content-type: application/json
body {
    "server": "server1",
    "users": ["user1","user2", "user3","user4"]
}


데이터 출력하기

api GET http://localhost:9200/value-list-index/_doc/1


Object처럼 데이터 저장하기

Elasticsearch을 사용하다 보면 데이터를 일반적인 필드 형식으로 저장하는 것이 아닌 트리 구조로 데이터를 저장하고 싶은 상황이 있습니다. 즉 object형식으로 데이터를 저장해야 되는데 이럴 때 사용하는 것이 properties입니다. 이제부터 properties 사용법에 대하여 알아보겠습니다. (참고로 해당 방식처럼 Object형식으로 데이터를 저장하게 되면 인덱스의 구조가 복잡해져 검색하는 상황에 따라 검색의 성능이 저하될 수 있습니다. 참고하시고 본인의 데이터 검색 방식에 대하여 확인하시고 적용하는 것을 추천드립니다.)

properties 사용하기

데이터의 구조는 다음과 같습니다.

  • 학과
  • 학생
    • 이름
    • 나이
    • 이메일
api PUT http://localhost:9200/student-index
header Content-type: application/json
body {
    "mappings": {
        "properties": {
            "subject": {
                "type": "keyword"
            },
            "student": {
                "properties": {
                    "name": {
                        "type": "text"
                    },
                    "age": {
                        "type": "short"
                    },
                    "email": {
                        "type": "text"
                    }
                }
            }
        }
    }
}


출력 결과

추가적으로 데이터를 넣고 student-index를 출력하였습니다.

Object 형식의 필드를 추천하는 상황과 추천하지 않는 상황

상황에 따라 object형식으로 데이터를 저장할 때가 좋은 경우가 있는 반면 그렇지 않은 경우도 있습니다.


추천하는 상황

  • object의 필드 별로 데이터를 집계 및 통계를 내야 되는 경우

추천하지 않는 상황

  • 그냥 데이터를 저장하고 읽기만 하는 경우 오히려 데이터 검색 성능에 저하가 될 수 있습니다. 만약 그냥 데이터를 검색하는 데 사용하지 않고 텍스트 형식으로 출력하는데만 사용하신다면 그냥 필드를 text로 하여 json데이터를 text로 저장하는 것을 추천합니다.

참조

https://www.elastic.co/guide/en/elasticsearch/reference/current/object.html


Object field type | Elasticsearch Guide [7.14] | Elastic

If you need to index arrays of objects instead of single objects, read Nested first.

www.elastic.co


bulk란

Elasticsearch를 사용하면서 여러개의 데이터를 넣을때 매번 하나씩 데이터를 넣는 일은 네트워크의 잦은 IO의 발생으로 성능을 저하 시킬 수 있는 요인입니다. 이러한 문제를 해결하는 것이 bulk입니다. bulk는 여러개의 처리를 모아 두었다가 한번에 처리하는 batch 처리 기능입니다.


bulk를 통해 데이터 넣기

bulk를 사용하여 여러개의 데이터를 한번의 요청으로 넣을 수 있습니다.

api POST http://localhost:9200/my-log-index-2021-08-25/_bulk
header Content-type: Application/json
body {"index": {"_index": "my-log-index-2021-08-25", "_id": 1}}
{"user_id":1, "level":"info", "timestamp": 1629893888, "action": "open_file", "message": "user1 file open"}
{"index": {"_index": "my-log-index-2021-08-25", "_id": 2}}
{"user_id":2, "level":"info", "timestamp": 1629893890, "action": "open_file", "message": "user2 file open"}
{"index": {"_index": "my-log-index-2021-08-25", "_id": 3}}
{"user_id":3, "level":"info", "timestamp": 1629893891, "action": "open_socket", "message": "user3 socket open"}
{"index": {"_index": "my-log-index-2021-08-25", "_id": 4}}
{"user_id":4, "level":"info", "timestamp": 1629893892, "action": "open_socket", "message": "user4 socket open"}
{"index": {"_index": "my-log-index-2021-08-25", "_id": 5}}
{"user_id":5, "level":"info", "timestamp": 1629893893, "action": "open_file", "message": "user5 file open"}
{"index": {"_index": "my-log-index-2021-08-25", "_id": 6}}
{"user_id":6, "level":"info", "timestamp": 1629893893, "action": "close_file", "message": "user6 close open"}
{"index": {"_index": "my-log-index-2021-08-25", "_id": 7}}
{"user_id":7, "level":"info", "timestamp": 1629893895, "action": "close_socket", "message": "user7 close socket"}

중요 ) 여기서 만약에 Postman, 크롬에 ARS와 같이 http요청을 보내는 RestClient 프로그램을 사용하신다면 body 마지막에 개행(\n) 즉 enter키를 한번 더 입력해야 됩니다.


데이터가 잘 들어갔는지 확인하기

api GET http://localhost:9200/my-log-index-2021-08-25/_search


bulk를 이용하여 데이터 입력, 수정, 삭제 한번에 하기

데이터 입력 뿐만 아니라 데이터 수정, 삭제를 한번의 bulk를 통하여 수행할 수 있습니다.


bulk로 입력, 수정, 삭제

api POST http://localhost:9200/my-log-index-2021-08-25/_bulk
header Content-type: Application/json
body {"index": {"_index": "my-log-index-2021-08-25", "_id": 8}}
{"user_id":8, "level":"debuf", "timestamp": 1629893993, "action": "close_file", "message": "user8 close open"}
{"index": {"_index": "my-log-index-2021-08-25", "_id": 9}}
{"user_id":9, "level":"warn", "timestamp": 1629893995, "action": "error", "message": "failed user9 connection"}
{"update": {"_index": "my-log-index-2021-08-25", "_id": 1}}
{"doc": {"level": "debug"}}
{"update": {"_index": "my-log-index-2021-08-25", "_id": 2}}
{"doc": {"level": "debug"}}
{"delete": {"_index": "my-log-index-2021-08-25", "_id": 6}}

중요 ) 여기서 만약에 Postman, 크롬에 ARS와 같이 http요청을 보내는 RestClient 프로그램을 사용하신다면 body 마지막에 개행(\n) 즉 enter키를 한번 더 입력해야 됩니다.

벌크의 내용

8번, 9번 유저의 데이터를 추가하고

1번, 2번 유저의 level필드의 값을 debug로 수정하고

6번 유저의 데이터를 삭제합니다.


결과 확인

크롬의 "Elasticsearch Head"라는 확장 프로그램을 사용하여 결과를 확인하겠습니다.

"Elasticsearch Head"의 설치 방법은 링크과 같습니다.

https://stdhsw.tistory.com/entry/Elasticsearch-%EC%9C%88%EB%8F%84%EC%9A%B010-%EC%84%A4%EC%B9%98%ED%95%98%EA%B8%B0


Elasticsearch 윈도우10에 설치하기

Elasticsearch 다운로드 https://www.elastic.co/kr/downloads/elasticsearch 해당 주소에서 elasticsearch를 다운로드합니다. Elasticsearch 실행하기 압축을 푼 폴더 위치에서 bin/elasticsearch.bat파일을 실..

stdhsw.tistory.com


인덱스의 구조는 이전 template 설정과 같습니다.
https://stdhsw.tistory.com/entry/Elasticsearch%EC%9D%98-Index-template-%EC%84%A4%EC%A0%95

현재 인덱스 구조

필드 타입
user_id long
level keyword
timestamp long
action keyword
message text


도큐먼트 생성하기

Elasticsearch index에 document를 생성하여 각각의 필드에 값을 설정하고 index에 데이터를 넣습니다.
user 1 추가하기

api PUT http://localhost:9200/my-log-index-2021-08-24/_doc/1
header Content-type: application/json
body {
    "user_id": 1,
    "level": "info",
    "timestamp": 1629792520,
    "action": "open_file",
    "message": "user file open"
}


user 2 추가하기

api PUT http://localhost:9200/my-log-index-2021-08-24/_doc/2
header Content-type: application/json
body {
    "user_id": 2,
    "level": "info",
    "timestamp": 1629792525,
    "action": "open_socket",
    "message": "user socket open"
}


덮어쓰기를 방지하기 위한 데이터 생성방법
기존처럼 PUT http://localhost:9200/my-log-index-2021-08-24/_doc/2 을 사용하여 데이터를 생성한다면 기존에 도큐먼트 아이디 2가 존재한다면 기존의 데이터는 지워지고 현재 데이터가 덮어써지는 문제가 발생합니다. 이러한 문제를 해결하기 위해 _create를 통하여 데이터를 생성할 수 있습니다.
만약 같은 도큐먼트 아이디가 존재 할 경우 status 409 version_conflict_engine_exception 에러를 반환합니다.

api POST http://localhost:9200/my-log-index-2021-08-24/_create/2
header Content-type: application/json
body {
    "user_id": 3,
    "level": "info",
    "timestamp": 1629792540,
    "action": "close_file",
    "message": "user close open"
}


도큐먼트 조회하기

지금까지 입력한 데이터를 조회하도록 하겠습니다.

인덱스에 모든 도큐먼트 조회하기

api GET http://localhost:9200/my-log-index-2021-08-24/_search

출력 결과


특정 도큐먼트 아이디를 이용하여 조회하기
이번에는 인덱스의 모든 데이터가 아닌 도큐먼트 아이디를 이용하여 해당 도큐먼트의 값을 가져오도록 하겠습니다.

api GET http://localhost:9200/my-log-index-2021-08-24/_doc/1

출력 결과


조건을 이용하여 데이터 조회하기
이번에는 특정 조건에 만족하는 데이터를 찾아 조회하도록 하겠습니다.
action 필드의 값이 "open_socket"인 것을 조회하도록 하겠습니다.

api GET http://localhost:9200/my-log-index-2021-08-24/_search?q=action:open_socket

출력 결과


도큐먼트 수정하기

데이터를 수정하기 전에 먼저 version의 값을 확인하면 좋습니다.

api GET http://localhost:9200/my-log-index-2021-08-24/_doc/2

출력 결과
출력 결과를 보면 알 수 있듯이 현재 수정을 하지 않은 상태에서는 version이 1입니다.


도큐먼트 아이디를 이용하여 수정하기
도큐먼트 수정하는 것도 조회와 마찬가지로 도큐먼트 아이디를 이용하여 level 필드의 값을 "debug"로 수정하도록 하겠습니다.
_update를 사용하면 기존에 도큐먼트 아이디가 존재하지 않는 다면 에러가 발생합니다.

api POST http://localhost:9200/my-log-index-2021-08-24/_update/2
header Content-type: application/json
body {
    "doc": {
        "level": "debug"
    }
}


버전 확인하기

api GET http://localhost:9200/my-log-index-2021-08-24/_doc/2

출력 결과
버전이 2로 증가하였습니다. 버전은 해당 도큐먼트 아이디의 변경된 횟수를 의미합니다. 버전을 통하여 해당 도큐먼트의 아이디가 수정된 적이 있는지 확인할 수 있습니다.


도큐먼트 개수 측정하기

인덱스의 모든 도큐먼트 개수 측정하기

api GET http://localhost:9200/my-log-index-2021-08-24/_count


특정 조건을 이용하여 개수 측정하기
level 필드에 값이 "debug"인 도큐먼트 개수 측정

api GET http://localhost:9200/my-log-index-2021-08-24/_count?q=level:debug


도큐먼트 삭제하기

특정 도큐먼트 삭제하기

api DELETE http://localhost:9200/my-log-index-2021-08-24/_doc/2


인덱스 삭제하기
인덱스를 삭제하여 인덱스의 모든 값을 삭제합니다.

api DELETE http://localhost:9200/my-log-index-2021-08-24


reindex를 사용하는 이유

Elasticsearch를 사용하다 보면 ilm(Index life management)로 인하여 일정 기간이 지나면 인덱스가 지워집니다. 그러한 상황에서 중요한 로그 데이터를 보관하기 위해서 기존의 인덱스를 복사해 두는 것이 중요합니다. 이럴 때 사용하는 것이 reindex입니다.


사용방법

api POST http://localhost:9200/_reindex
header Content-type: application/json
body {
  "source": {
    "index": "기존_인덱스_명"
  },
  "dest": {
    "index": "변경할_인덱스_명"
  }
}


reindex를 사용했던 상황

로그의 내용을 분석하기 위해 ilm을 통해 로그 인덱스가 삭제 되지 않도록 인덱스명 변경하기

api POST http://localhost:9200/_reindex
header Content-type: application/json
body {
  "source": {
    "index": "my-log-index-2021-08-24"
  },
  "dest": {
    "index": "backup-log-index"
  }
}


참조

https://www.elastic.co/guide/en/elasticsearch/reference/current/docs-reindex.html


Reindex API | Elasticsearch Guide [7.14] | Elastic

Deprecated in 7.6. Sort in reindex is deprecated. Sorting in reindex was never guaranteed to index documents in order and prevents further development of reindex such as resilience and performance improvements. If used in combination with max_docs, conside

www.elastic.co


Index ilm policy이란

ILM (Index Lifecycle Management)은 데이터 인덱스의 수명 주기를 관리하기 위한 기능입니다. ILM를 사용하면 데이터의 보존, 압축, 백업 및 삭제와 같은 다양한 관리 작업을 자동화하고 데이터 스토리지를 효율적으로 관리할 수 있는 기능을 제공하지만 이번 문서에서는 아주 간단하게 인덱스가 생성되고 일정 기간이 지나면 인덱스가 삭제되도록 하는 방법에 대하여 정리하였습니다.

보다 자세한 ILM 설명은 링크를 확인해주세요 (https://stdhsw.tistory.com/entry/Elasticsearch-%EC%B5%9C%EC%A0%81%ED%99%94-3-ilm-policy%EB%A1%9C-data-tiering-%ED%95%98%EA%B8%B0)


Index ilm policy 설정하기

PUT localhost:9200/_ilm/policy/my-policy
Content-Type: application/json

{
  "policy": {
    "phases": {
      "delete": {
        "min_age": "3d",
        "actions": {
          "delete": {}
        }
      }
    }
  }
}

ilm policy 파라미터

  • delete.min_age : 인덱스가 생성되고 얼마만큼의 기간이 흐르면 지울지 설정합니다.


Index ilm policy 설정 확인 하기

GET localhost:9200/_ilm/policy/my-policy

### 결과
{
  "my-policy": {
    "version": 1,
    "modified_date": "2023-10-25T09:43:53.527Z",
    "policy": {
      "phases": {
        "delete": {
          "min_age": "3d",
          "actions": {
            "delete": {
              "delete_searchable_snapshot": true
            }
          }
        }
      }
    },
    "in_use_by": {
      "indices": [],
      "data_streams": [],
      "composable_templates": []
    }
  }
}


ILM Policy를 Index template에 적용하기

인덱스 template에 ILM 설정을 적용합니다. 인덱스 template에 대한 자세한 설명은 링크를 확인해 주세요 (https://stdhsw.tistory.com/entry/Elasticsearch%EC%9D%98-Index-template-%EC%84%A4%EC%A0%95)

PUT http://localhost:9200/_template/my-index-template
Content-Type: application/json

{
  "index_patterns": ["my-index*"],
  "settings": {
    "index": {
      "number_of_shards": "2",
      "number_of_replicas": "1",
      "refresh_interval": "5s",
      "lifecycle": {
        "name": "my-policy"
      }
    }
  },
  "mappings": {
    "properties": {
      "app": {
        "type": "keyword"
      },
      "level": {
        "type": "keyword"
      },
      "message": {
        "type": "text"
      }
    }
  }
}

Index template 파라미터

  • settings.index.lifecycle.name : 위에서 지정한 ILM의 명칭을 기입합니다.

위 설정을 적용하면 이제 "my-index"로 시작하는 모든 인덱스는 앞으로 생성되고 3일 뒤에 자동적으로 삭제가 되어 보다 효율적으로 디스크 사용량을 관리할 수 있습니다.


Index ilm policy 삭제하기

### delete
DELETE localhost:9200/_ilm/policy/my-policy


Index template 사용 이유

Elsticsearch에서 index의 template을 지정하지 않을 경우 인덱스를 생성할 때마다 shard 및 field type을 계속해서 지정을 해줘야 하는 귀찮은 문제가 발생합니다. 저 같은 경우 인덱스를 날짜 별로 생성하는 Rolling 방식을 이용하고 있는데 만약 template이 존재하지 않았다면 매일 00시마다 인덱스를 생성하는 노가다를 하게 될 겁니다.

template를 사용하게 되면 특정 패턴의 인덱스가 생성될때 template으로 지정된 설정이 자동으로 적용되어 인덱스가 생성되기 때문에 shard, refresh, field 타입이 자동으로 적용됩니다. 

Field data type 종류

default 타입으로 설정되어 생성됩니다. 문자열인 경우 keyword, text 둘 다 지정되며, 숫자인 경우 long 타입으로 설정됩니다. 기본 값으로 사용하는데 문제가 없다면 그냥 사용해도 되지만 최적화를 하거나 리소스의 자원을 아끼며, 상황에 맞게 Analyzer의 기능을 사용할 때는 반듯이 template을 생성하고 해당 template를 기반으로 인덱스가 생성되어 사용하는 것을 권장합니다.

각각의 필드의 타입에 대해서는 아래 elasticsearch 공식 document를 통하여 확인하여 주시기 바랍니다.

https://www.elastic.co/guide/en/elasticsearch/reference/current/mapping-types.html


Field data types | Elasticsearch Guide [8.10] | Elastic

Each field has a field data type, or field type. This type indicates the kind of data the field contains, such as strings or boolean values, and its intended use. For example, you can index strings to both text and keyword fields. However, text field value

www.elastic.co

Index ilm policy 설정하기

curl -X PUT http://localhost:9200/_ilm/policy/my-log-policy -H 'Content-Type: application/json' -d '
{
  "policy": {
    "phases": {
      "delete": {
        "min_age": "3d",
        "actions": {
          "delete": {}
        }
      }
    }
  }
}
'

먼저 인덱스 Template를 설정하기 전에 ilm에 대해서 간단하게 알아보겠습니다. ilm이란 Index Lifecycle Management로 인덱스의 생명 주기 및 인덱스 크기를 관리해 주는 기능입니다.  위 설정은 "my-log-policy"라는 ilm을 생성하는 API이며 파라미터의 대한 설명은 다음과 같습니다.

  • policy.phases.delete.min_age : 인덱스의 생명 주기입니다. 저는 3일로 설정하였습니다.
  • policy.phases.delete.action : 3일 뒤 수행하는 action입니다. 저는 인덱스가 생성된 지 3일이 지나면 해당 인덱스를 삭제하도록 설정하였습니다.

이번 문서는 인덱스 Template에 대한 설명이기 때문에 ilm policy의 삭제에 대해서만 간단하게 설정하였습니다. ilm의 기능으로는 삭제뿐만 아니라 hot, warm, cold, rollover등과 같은 여러 가지의 기능을 제공하고 있습니다.

Index template 설정하기

"my-log-template"이라는 template를 shard 개수를 4개, 각 샤드의 복제본 1개 그리고 5초마다 한 번씩 refresh를 수행하여 데이터가 검색될 수 있도록 설정을 하며 필드의 타입은 다음과 같이 설정하도록 하였습니다.

Field명 Type
level keyword
timestamp date
logger keyword
message text
msg로 시작하는 Field text
그밖에 문자열 keyword
그밖에 숫자 integer


curl -X PUT http://localhost:9200/_template/my-log-template -H 'Content-Type: application/json' -d '
{
  "index_patterns": [
    "my-log-*"
  ],
  "settings": {
    "index": {
      "number_of_shards": "4",
      "number_of_replicas": "1",
      "refresh_interval": "5s",
      "lifecycle": {
        "name": "my-log-policy"
      }
    }
  },
  "mappings": {
    "properties": {
      "level": {
        "type": "keyword"
      },
      "timestamp": {
        "type": "date",
        "format": "yyyy-MM-dd HH:mm:ss"
      },
      "logger": {
        "type": "keyword"
      },
      "message": {
        "type": "text"
      },
      "action": {
        "type": "keyword"
      }
    },
    "dynamic_templates": [
      {
        "message": {
          "match_mapping_type": "string",
          "match": "msg*",
          "mapping": {
            "type": "text"
          }
        }
      },
      {
        "default_strings": {
          "match_mapping_type": "string",
          "mapping": {
            "type": "keyword"
          }
        }
      },
      {
        "default_number": {
          "match_mapping_type": "long",
          "mapping": {
            "type": "integer"
          }
        }
      }
    ]
  }
}
'

인덱스의 template은 인덱스 필드의 데이터 타입을 설정하는 것뿐만 아니라 인덱스의 전체적인 설정을 지정하는 기능을 합니다. 인덱스는 하나 이상의 샤드로 구성되어 있습니다. 샤드는 인덱스의 데이터를 분할되어 여러 노드에 나눠 저장되어 한 노드에 부하가 집중되는 것을 방지하며 replica 샤드를 통하여 고가용성(HA)을 보장하는 기능을 수행합니다. 이러한 설정을 인덱스의 template 설정을 통하여 지정할 수 있습니다. 위 request를 통하여 "my-log-template"라는 template을 설정하고 "my-log-"로 시작되는 모든 인덱스에 해당 설정이 적용됩니다. 파라미터에 대한 설명은 다음과 같습니다.

  • index_patterns : 해당 templat이 적용되는 인덱스명의 패턴을 입력합니다. 저는 "my-log-"로 시작되는 새롭게 생성되는 인덱스에 template이 적용되도록 설정하였습니다.
  • settings.index.number_of_shards : 인덱스는 하나 이상의 샤드로 구성되어 있는데 샤드의 개수를 늘려 여러 노드에 분할 저장될 수 있도록 설정할 수 있습니다. 해당 설정은 샤드의 개수를 지정하는 것인데 너무 많은 설정으로 구성하면 Elasticsearch의 Cluster 전체에 악영향을 미칠 수 있기 때문에 적당한 양의 샤드로 구성하는 것을 권장합니다. 저는 웬만하면 Data Node 개수의 배수로 설정하여 여러 Data Node에 골고루 분할할 수 있도록 설정합니다. 한 인덱스에 최대로 설정할 수 있는 샤드의 개수는 1024개입니다.
  • settings.index.number_of_replicas : 고가용성을 보장하기 위해 복제본 샤드의 개수를 설정합니다. 너무 많은 복제 샤드를 설정하면 데이터 보존의 안정성은 보장되지만 클러스터에 많은 부하가 발생할 수 있습니다. 저는 복제본 샤드를 1개로 구성하여 HA를 보장하지만 클러스터에 부하를 최소한으로 하도록 설정하여 사용합니다.
  • settings.index.refresh_interval : Elasticsearch는 데이터가 저장되면 바로 검색이 되지 않습니다. 인덱스에 refresh가 되어야지 검색이 가능해집니다. refresh가 1초마다 되면 실시간에 가깝게 검색을 수행할 수 있지만 데이터에 삽입되는 Indexing의 성능이 저하될 수 있습니다. 만약 실시간 검색이 중요하면 1초로 설정하지만 그렇지 않다면 어느 정도 긴 시간을 설정하는 것을 추천합니다. 저 같은 경우 로그 데이터 엄청 많은 양의 데이터가 발생할 수 있기 때문에 데이터가 안정적으로 들어오는 것이 중요하다고 판단하여 5초로 설정하였습니다. ML분야에 개발자 분들은 하루동안 데이터를 모으고 다음날 데이터를 분석할 때는 refresh가 하루에 한 번 또는 한 시간에 한번 수행하는 경우도 있다고 합니다.
  • settings.index.lifecycle.name : 인덱스의 lifecycle을 지정합니다. 위에서 설정한 ilm을 지정하여 인덱스가 생성되고 3일 뒤에 삭제 하도록 하였습니다.

다음은 데이터 필드 타입을 설정하는 부분입니다. https://www.elastic.co/guide/en/elasticsearch/reference/current/mapping-types.html 해당 페이지에서 데이터 필드 타입에 대하여 알아보는 것을 권장합니다.

  • mappings.properties : 데이터 필드의 타입을 지정합니다. level필드는 keyword타입, timestamp는 date타입, logger는 keyword타입, message는 text타입, action은 keyword타입으로 설정하였습니다. 이 것 이외에 여러 데이터 타입이 있습니다.
  • mappings.dynamic_templates : dynamic_template은 데이터의 필드 명칭이 명확하지 않을때 사용하는 기능입니다.
  • mappings.dynamic_templates.message : message dynamic_template은 문자열로 입력된 msg로 시작되는 명칭의 필드가 들어오면 해당 필드의 타입은 text로 지정합니다. 
  • mappings.dynamic_templates.default_strings : 모든 문자열로 들어온 지정되지 않은 필드는 무조건 keyword 타입으로 설정합니다.
  • mappings.dynamic_templates.default_number : 모든 숫자형식으로 들어온 지정되지 않은 필드는 무조건 integer 타입으로 설정합니다.

Index template 확인

위 request를 통하여 생성된 인덱스 template을 확인합니다.

curl -XGET http://localhost:9200/_template/my-log-template

모든 Index template 가져오기

Elasticsearch에 설정된 모든 Index의 template를 가져옵니다.

curl -XGET http://localhost:9200/_template

Index template 삭제하기

더 이상 해당 Index의 template을 사용하지 않을 경우 Index template을 삭제합니다.

curl -XDELETE http://localhost:9200/_template/my-log-template

마지막으로

Elasticsearch의 template설정은 데이터 삽입 및 검색의 성능에 많은 영향을 미칠 수 있습니다. 자신의 환경 및 상황에 맞게 인덱스를 설정한다면 보다 더 효율적인 클러스터 운영이 가능해지기 때문에 데이터의 형식 및 검색할 때 어떻게 검색할 것인지를 파악하고 template를 반듯이 설정하는 것을 권장합니다.


Kibana 다운로드하기

https://www.elastic.co/kr/downloads/kibana 링크에서 파일을 다운로드합니다.


Kibana 실행하기

다운로드하고 압축을 풀면 압축 푼 폴더에 bin/kibana.bat를 실행합니다. 특별한 설정을 하지 않았다면 Elasticsearch는 9200 포트로 설정되고 kibana는 5601 포트로 설정됩니다. 웹 브라우저 주소창에 http://localhost:5601에 접속하여 kibana가 설치되었는지 확인합니다. 그리고 Explore on my own을 선택하면 됩니다.


Kibana와 Elasticsearch 연결 확인하기

Elasticsearch와 kibana가 실행되고 있다면 http://localhost:5601로 접속하여 Dev tools를 선택하여 들어갑니다.


Dev tools로 들어와서 GET / 명령를 실행하여 다음과 같이 출력되었다면 정상적으로 연결이 된 것입니다.


Elasticsearch 다운로드

https://www.elastic.co/kr/downloads/elasticsearch 해당 주소에서 elasticsearch를 다운로드합니다.

Elasticsearch 다운로드

Elasticsearch 실행하기

압축을 푼 폴더 위치에서 bin/elasticsearch.bat파일을 실행하면 됩니다.


Elasticsearch 실행 확인하기 (크롬 Elasticsearch Head 설치하기)

Elasticsearch Tool의 경우 여러 가지가 있지만 저 같은 경우 크롬 확장 프로그램 중 하나인 Elasticsearch Head라는 프로그램을 사용하고 있습니다. https://chrome.google.com/webstore/category/extensions 링크에서 Elasticsearch Head를 검색하여 설치를 진행합니다.


설치하고 나면 확장 프로그램을 고정하여 편하게 사용합니다.

chrome://extensions/ 다음 링크를 들어가서 활성화 버튼을 클릭합니다.

크롬 우측상단에 Elasticsearch Head 아이콘이 추가된 걸 확인할 수 있습니다. 해당 아이콘을 클릭하면 Elasticsearch에 접속할 수 있는 화면이 나타납니다.


Elasticsearch Head로 Elasticsearch 접속하기

Connect창에 http://localhost:9200을 입력하여 Connect 버튼을 클릭하면 자동으로 연결이 됩니다.

아직 Elasticsearch의 포트번호를 디폴트로 설정했기 때문에 포트번호는 9200으로 설정되어 있습니다.


reflect 사용 이유

reflect는 여러 가지의 사용방법이 있겠지만 저는 종종 협업을 하면서 상대방이 보낸 데이터의 타입 및 종류에 대하여 구분이 필요한 경우 사용하였습니다. 


reflect를 이용하여 타입 가져오기

인터페이스 형식으로 데이터를 받아 받은 데이터의 타입을 구분할 수 있습니다.

package main

import (
	"fmt"
	"reflect"
)

func ShowType(i interface{}) {
	fmt.Println(reflect.ValueOf(i).Type())
}

func main() {
	num := 100
	ShowType(num)

	job := "student"
	ShowType(job)
}
/* 출력결과
int
string
*/

코드설명

reflect.ValueOf().Type()을 사용하여 해당 타입이 어떤 타입인지 알 수 있습니다.


reflect를 이용하여 구조체 멤버 변수 확인하기

reflect를 사용하여 인터페이스로 받은 구조체의 멤버 변수들을 확인하도록 하겠습니다. 여기서 중요한 건 멤버 변수가 없는 일반 변수의 인터페이스를 넘기면 panic이 발생합니다.

package main

import (
	"fmt"
	"reflect"
)

type Person struct {
	Name string `json:"name"`
	Age  int    `json:"age"`
	Job  string `json:"job"`
}

func (p Person) Print() {
	fmt.Println(p.Name, " is ", p.Job)
}

func ShowMetaData(i interface{}) {
	elements := reflect.ValueOf(i).Elem()

	for index := 0; index < elements.NumField(); index++ {
		typeField := elements.Type().Field(index)
		fmt.Println(typeField.Name, typeField.Type, typeField.Tag, elements.Field(index))
	}
}

func main() {
	p := &Person{
		Name: "Han",
		Age:  30,
		Job:  "Developer",
	}
	ShowMetaData(p)

	// panic 발생
	//num := 100
	//ShowMetaData(num)
}

/* 출력결과
Name string json:"name" Han
Age int json:"age" 30
Job string json:"job" Developer
*/

코드설명

ShowMetaData() 함수를 보면 interface의 value를 reflect.Value().Elem()을 통하여 elements들을 가져옵니다. 그리고 

elements.Type().Field()를 통하여 현재 필드의 데이터를 StructField형식으로 가져올 수 있습니다. StructField의 구조는 다음과 같습니다.


StructField의 구조

// A StructField describes a single field in a struct.
type StructField struct {
	// Name is the field name.
	Name string
	// PkgPath is the package path that qualifies a lower case (unexported)
	// field name. It is empty for upper case (exported) field names.
	// See https://golang.org/ref/spec#Uniqueness_of_identifiers
	PkgPath string

	Type      Type      // field type
	Tag       StructTag // field tag string
	Offset    uintptr   // offset within struct, in bytes
	Index     []int     // index sequence for Type.FieldByIndex
	Anonymous bool      // is an embedded field
}

Name : 구조체 멤버 변수의 이름

Type : 구조체 맴버변수의 타입

Tag : 구조체 맴버변수의 태그

Offset : 구조체 멤버 변수의 오프셋(맴버변수의 메모리 위치)

Index : 구조체 맴버변수의 선언 순서


reflect를 이용하여 멤버 변수 가져오기

package main

import (
	"fmt"
	"reflect"
)

type Person struct {
	Name   string `json:"name"`
	Age    int    `json:"age"`
	Job    string `json:"job"`
	Salary int    `json:"salary"`
}

func (p Person) Print() {
	fmt.Println(p.Name, " is ", p.Job)
}

func (p *Person) SetSalary(salary int) {
	p.Salary = salary
}

func (p Person) GetName() string {
	return p.Name
}

func ShowMethod(i interface{}) {
	value := reflect.ValueOf(i)

	for index := 0; index < value.NumMethod(); index++ {
		fmt.Printf("method name : %s\n", value.Type().Method(index).Name) // 1번
		fmt.Printf("method type : %v\n\n", value.Method(index).Type()) // 2번
	}
}

func main() {
	p := &Person{
		Name: "Han",
		Age:  30,
		Job:  "Developer",
	}
	ShowMethod(p)
}

/* 출력결과
method name : GetName
method type : func() string

method name : Print
method type : func()

method name : SetSalary
method type : func(int)
*/

코드설명

1번 주석을 보면 Type().Method()를 통하여 구조체의 메서드의 타입을 가져올 수 있습니다. 가져온 메서드 타입으로 메서드 명을 가져올 수 있습니다.

2번 주석을 보면 Method().Type()을 통해 실제 메서드의 구성을 알 수 있습니다.


'Go언어' 카테고리의 다른 글

go work 사용해보기  (0) 2023.07.06
Ubuntu(Linux)에서 Go 재설치  (0) 2022.10.30
Go언어 Cron  (0) 2021.06.15
Prometheus Go언어 Metric label  (0) 2021.06.14
Prometheus Go언어 Metric 생성  (0) 2021.06.13

Cron이란

우리는 살면서 종종 정해진 시간에 정해진 일이 자동으로 수행되었으면 하는 일들이 많이 있습니다. Go언어에서는 이러한 일을 cron이 해결해 줍니다.


먼저 프로젝트 디렉토리에서 다음 명령어로 모듈을 가져옵니다.

 > go get github.com/robfig/cron
package main

import (
    "fmt"
    "github.com/robfig/cron"
    "time"
)

const (
    CronSpec = "30 * * * * *"
)

var (
    Data int
)

func PrintData() {
    t := time.Now().Format(time.ANSIC)
    fmt.Println(t, " : ", Data)
    Data++
}

func main() {
    c := cron.New()
    c.AddFunc(CronSpec, PrintData)
    c.Start()

    time.Sleep(time.Minute * 10)
    c.Stop()
}
/* 출력결과
Tue Jun 15 15:15:30 2021  :  0
Tue Jun 15 15:16:30 2021  :  1
Tue Jun 15 15:17:30 2021  :  2
*/

코드설명

cron.New()를 통하여 cron을 생성하고 AddFunc()를 통해 동작할 시간대와 동작할 함수를 등록합니다. "30 * * * * *"을 cron 시간으로 등록하였습니다. 이것은 출력결과를 보면 알 수 있듯이 매시간 매분 30초 일때 마다 함수가 동작합니다.


Cron Spec 구조

CronSpec을 "30 * * * * *"로 설정하였습니다. 여기서 많이 착가할 수 있는 부분이 30초 마다 동작을 수행하는 것으로 오해할 수 있습니다. 그러나 이것은 매 시간 매분 30초가 되었을 경우 수행하는 것을 의미합니다. 이제 Cron spec에 구조에 대하여 알아보겠습니다.

가장 왼쪽 부터 초, 분, 시, 일, 월, 요일 로 구성되어 있습니다.

Seconds Minute Hour Day of month Month Week
0 ~ 59 0 ~ 59 0 ~ 23 1 ~ 31 1 ~ 12 0 ~ 6

예제

"0 0 0 * * *" : 매일 0시 0분 0초에 수행합니다.

"0 0 0 1 1 *" : 1월 1일 0시 0분 0초에 수행합니다.


Cron Spec에서 사용되는 문자

별표 *

별표는 눈치채셨겠지만 모든 값을 뜻합니다.


콤마 ,

콤마는 해당 spec에 여러개의 값을 설정하는데 사용합니다. "10,20,30 * * * * *" 이렇게 설정을 한다면 매시 매분 10초, 20초, 30초 일때 수행합니다.


마이너스 -

마이너스는 값의 범위를 지정합니다. "10-15 * * * * *"일 경우 매시 매분 10초 11초 12초 13초 14초 15초 에 수행합니다.


슬래쉬 /

슬래쉬의 경우 해당 범위에서 수행하는 간격을 의미 합니다. "10-50/5 * * * * *" 일 경우 매시 매분에서 10초에서 50초 사이에 5초에 한번씩 수행합니다.


'Go언어' 카테고리의 다른 글

go work 사용해보기  (0) 2023.07.06
Ubuntu(Linux)에서 Go 재설치  (0) 2022.10.30
Go언어 interface reflect  (0) 2021.08.15
Prometheus Go언어 Metric label  (0) 2021.06.14
Prometheus Go언어 Metric 생성  (0) 2021.06.13

Label이란

Label이란 메트릭에 Key-Value형식으로 Metric을 구분하는데 많이 사용된다. Kubernetes에서는 Pod, Node, Cluster, 또는 Application 등을 Metric에서 구분하는데 많이 사용된다.


Go언어 Metric에 Label 등록하기

package main

import (
	"github.com/prometheus/client_golang/prometheus"
	"github.com/prometheus/client_golang/prometheus/promauto"
	"github.com/prometheus/client_golang/prometheus/promhttp"
	"net/http"
	"time"
)

const (
	LabelAppName = "application_name"
	LabelFuncName = "function_name"
)

var (
	MyCounter *prometheus.CounterVec
)

func Init() {
	MyCounter = promauto.NewCounterVec(prometheus.CounterOpts{
		Name: "my_test_count",
		Help: "my test count",
	},[]string{
		LabelAppName,
		LabelFuncName,
	})
}

func RunFunc1() {
	labels := prometheus.Labels{
		LabelAppName: "my_app",
		LabelFuncName: "run_func1",
	}

	for {
		MyCounter.With(labels).Inc()
		time.Sleep(time.Second * 2)
	}
}

func RunFunc2() {
	labels := prometheus.Labels{
		LabelAppName: "my_app",
		LabelFuncName: "run_func2",
	}

	for {
		MyCounter.With(labels).Inc()
		time.Sleep(time.Second * 5)
	}
}

func main() {
	Init()
	go RunFunc1()
	go RunFunc2()

	http.Handle("/metrics", promhttp.Handler())
	http.ListenAndServe(":30001", nil)
}

코드설명

기존 Metric의 코드와 크게 다르지 않다. prometheus.CounterVec를 통하여 메트릭을 생성하고 메트릭을 생성할 때 상수로 선언된 LabelAppName, LabelFuncName을 통하여 application_name, function_name이라는 Label을 등록하였습니다. 그리고 각각의 RunFunc1(), RunFunc2() 함수로 각각 별도의 function_name의 Label을 등록하였습니다.

Promql로 구분하여 검색하기

기존처럼 Metric 이름으로 검색하면 run_func1, run_func2가 모두 검색됩니다.

my_test_count

Label에 run_func1을 지정하여 특정 Label의 Metric을 검색하면 run_func1만 검색됩니다.

my_test_count{function_name="run_func1"}


결과 확인하기


'Go언어' 카테고리의 다른 글

go work 사용해보기  (0) 2023.07.06
Ubuntu(Linux)에서 Go 재설치  (0) 2022.10.30
Go언어 interface reflect  (0) 2021.08.15
Go언어 Cron  (0) 2021.06.15
Prometheus Go언어 Metric 생성  (0) 2021.06.13

Prometheus Metric Type

Counter 카운터

Counter는 개수를 측정하거나 증가하는 값을 측정할 때 사용합니다. 카운터는 0으로 초기화는 가능하지만 값을 감소할 수 없고 증가만 할 수 있습니다. 대표적으로 함수 호출 횟수 및 접속 요청 수, 실패 개수를 측정할 때 많이 사용할 수 있습니다.


Gauge 게이지

Gauge는 현재의 값을 나타내는 데 사용합니다. 값이 증가할 수 있으며 감소할 수도 있습니다. 증가 감소 모두 가능하다 보니 여러 방면에서 사용할 수 있습니다. 대표적으로 현재 메모리 사용량, CPU 사용 시간, 저장된 데이터의 수, 스레드 개수 등 여러 방면에서 사용합니다.


Summary 서머리

Summary는 _count, _sum을 제공하여 평균을 측정할 수 있으며, 슬라이딩 시간 윈도우를 측정할 때 사용합니다.


Histogram 히스토그램

Histogram은 시간 동안의 값을 측정하고 측정한 값을 통하여 quantile을 측정할 수 있습니다.


Go언어로 Metric 생성하기

먼저 다음 명령으로 모듈을 받습니다.

go get github.com/prometheus/client_golang/prometheus
go get github.com/prometheus/client_golang/prometheus/promauto
go get github.com/prometheus/client_golang/prometheus/promhttp


Counter 생성하기

package main

import (
	"github.com/prometheus/client_golang/prometheus"
	"github.com/prometheus/client_golang/prometheus/promauto"
	"github.com/prometheus/client_golang/prometheus/promhttp"
	"net/http"
	"time"
)

var (
	MyCounter prometheus.Counter
)

func Init() {
	MyCounter = promauto.NewCounter(prometheus.CounterOpts{
		Name: "my_test_count",
		Help: "my test count",
	})
}

func RunCounter() {
	for i := 0; ; i++ {
		MyCounter.Inc()
		//MyCounter.Add(10)
		time.Sleep(time.Second * 2)
	}
}

func main() {
	Init()
	go RunCounter()

	http.Handle("/metrics", promhttp.Handler())
	http.ListenAndServe(":30001", nil)
}

코드설명

promauto.NewCounter를 통하여 카운터를 생성하고 카운터의 이름을 my_test_count로 만들었다. 카운터는 2초에 한 번씩 MyCounter.Inc()를 통하여 1씩 증가하고 있다. MyCounter.Add()를 이용하면 1 이상의 값을 증가시킬 수도 있다.


확인하기

Gauge 생성하기

package main

import (
	"github.com/prometheus/client_golang/prometheus"
	"github.com/prometheus/client_golang/prometheus/promauto"
	"github.com/prometheus/client_golang/prometheus/promhttp"
	"net/http"
	"time"
)

var (
	MyGauge prometheus.Gauge
)

func Init() {
	MyGauge = promauto.NewGauge(prometheus.GaugeOpts{
		Name: "my_test_gauge",
		Help: "my test gauge",
	})
}

func RunGauge() {
	for i := 0; ; i++ {
		MyGauge.Set(float64(i))
		time.Sleep(time.Second * 2)
	}
}

func main() {
	Init()
	go RunGauge()

	http.Handle("/metrics", promhttp.Handler())
	http.ListenAndServe(":30001", nil)
}

코드설명

promauto.NewGauge를 통하여 my_test_gauge를 생성하였습니다. 2초마다 i의 값으로 gauge값을 세팅합니다.


Summary 생성하기

package main

import (
	"github.com/prometheus/client_golang/prometheus"
	"github.com/prometheus/client_golang/prometheus/promauto"
	"github.com/prometheus/client_golang/prometheus/promhttp"
	"math/rand"
	"net/http"
	"time"
)

var (
	MySummary prometheus.Summary
)

func Init() {
	MySummary = promauto.NewSummary(prometheus.SummaryOpts{
		Name: "my_test_summary",
		Help: "my test summary",
	})
}

func RunSummary() {
	for {
		MySummary.Observe(float64(rand.Int63n(10)))
		time.Sleep(time.Second * 2)
	}
}

func main() {
	Init()
	go RunSummary()

	http.Handle("/metrics", promhttp.Handler())
	http.ListenAndServe(":30001", nil)
}

코드설명

promauto.NewSummary를 통하여 my_test_summary를 생성하고 2초마다 0 ~ 10까지의 난수로 Observe를 통하여 값을 등록합니다.


확인하기


Histogram 생성하기

package main

import (
	"github.com/prometheus/client_golang/prometheus"
	"github.com/prometheus/client_golang/prometheus/promauto"
	"github.com/prometheus/client_golang/prometheus/promhttp"
	"math/rand"
	"net/http"
	"time"
)

var (
	MyHistogram prometheus.Histogram
)

func Init() {
	MyHistogram = promauto.NewHistogram(prometheus.HistogramOpts{
		Name: "my_test_histogram",
		Help: "my test histogram",
	})
}

func RunHistogram() {
	for {
		MyHistogram.Observe(rand.Float64())
		time.Sleep(time.Second * 2)
	}
}

func main() {
	Init()
	go RunHistogram()

	http.Handle("/metrics", promhttp.Handler())
	http.ListenAndServe(":30001", nil)
}

코드설명

역시나 promauto.NewHistogram을 통해 생성합니다. 2초마다 난수를 등록합니다.


확인하기

다른 방식의 Metric 생성

지금까지 promauto를 통하여 Metric을 생성했습니다. 그러나 promauto를 사용하지 않고 다른 방식으로 Metric을 생성하는 방법을 알아보겠습니다.

package main

import (
	"github.com/prometheus/client_golang/prometheus"
	"github.com/prometheus/client_golang/prometheus/promhttp"
	"net/http"
	"time"
)

var (
	MyCounter prometheus.Counter
)

func Init() {
	MyCounter = prometheus.NewCounter(prometheus.CounterOpts{
		Name: "my_test_count",
		Help: "my test count",
	})
}

func RunFunc() {
	for {
		MyCounter.Inc()
		time.Sleep(time.Second * 2)
	}
}

func main() {
	Init()
	prometheus.MustRegister(MyCounter)

	go RunFunc()

	http.Handle("/metrics", promhttp.Handler())
	http.ListenAndServe(":30001", nil)
}

코드설명

promauto.NewCounter가 아닌 prometheus.NewCounter를 통하여 Metric을 생성했습니다. promauto를 사용하지 않으면 prometheus.MustRegister를 통하여 Collector를 등록해야 됩니다.


'Go언어' 카테고리의 다른 글

go work 사용해보기  (0) 2023.07.06
Ubuntu(Linux)에서 Go 재설치  (0) 2022.10.30
Go언어 interface reflect  (0) 2021.08.15
Go언어 Cron  (0) 2021.06.15
Prometheus Go언어 Metric label  (0) 2021.06.14

Prometheus 다운로드

https://prometheus.io/download/

위 주소에서 Prometheus를 다운로드 받고 압축을 풀어 줍니다.

Prometheus 실행하기

prometheus.exe 파일을 실행합니다.

Prometheus의 기본 Port번호는 9090입니다. 브라우저를 통하여 'localhost:9090'을 입력합니다.

Prometheus 화면

짜잔 ~!

프로메테우스가 정상적으로 동작합니다.


Prometheus 설정하기

Prometheus는 모니터링을 할려는 Client에서 Metric port를 오픈하면 해당 Client에 Metric 데이터를 가져옵니다. 그렇기 때문에 Metric 데이터를 가져올 Client의 Metric port를 등록해야 됩니다.

prometheus.yml 파일을 열어 수정합니다.

scrape_configs에 다음과 같은 내용을 추가합니다.

  - job_name: 'MyPrometheus'
    scrape_interval: 2s
    static_configs:
    - targets: ['localhost:30001']

job_name : 프로메테우스에 등록할 이름

scrape_interval : metric 데이터를 가져오는 시간

targets : metric 수집할 대상 (Exporter 등등)


모든 설정이 끝나면 Prometheus를 재시작 합니다.


Prometheus Target 확인하기

각각의 타겟이 정상적으로 떳는지 확인하고 싶을때는 Status -> Target에서 확인 가능합니다.


Prometheus에 대한 자세한 내용은 다음 링크를 통하여 확인하세요

https://prometheus.io/docs/introduction/overview/


Overview | Prometheus

An open-source monitoring system with a dimensional data model, flexible query language, efficient time series database and modern alerting approach.

prometheus.io


+ Recent posts